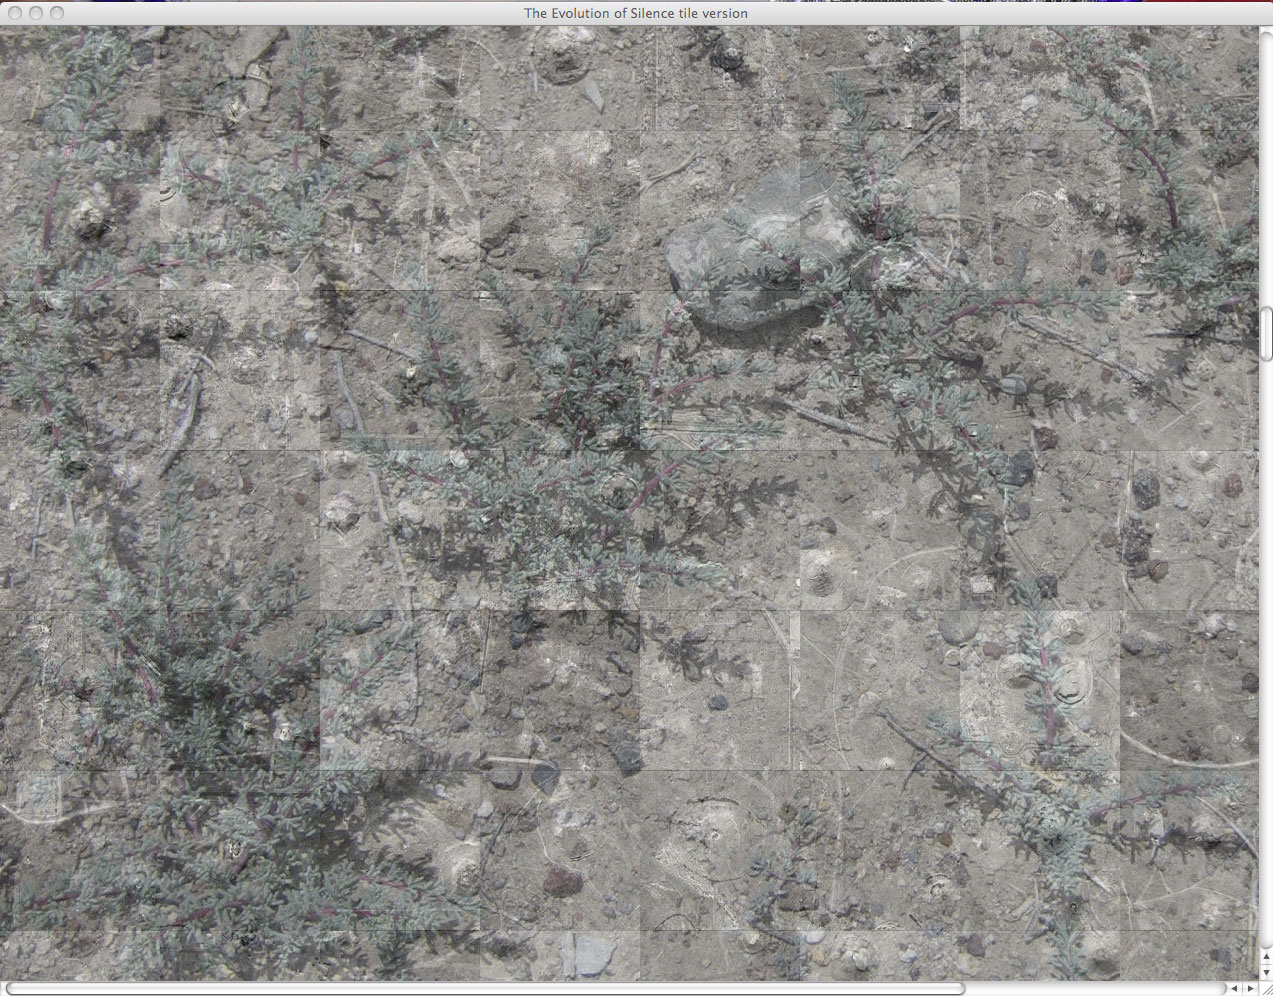
This is a screen shot of the web-based archive in which the detonations are organized initially by time (grid view). It presents the sites as fragments of a landscape.
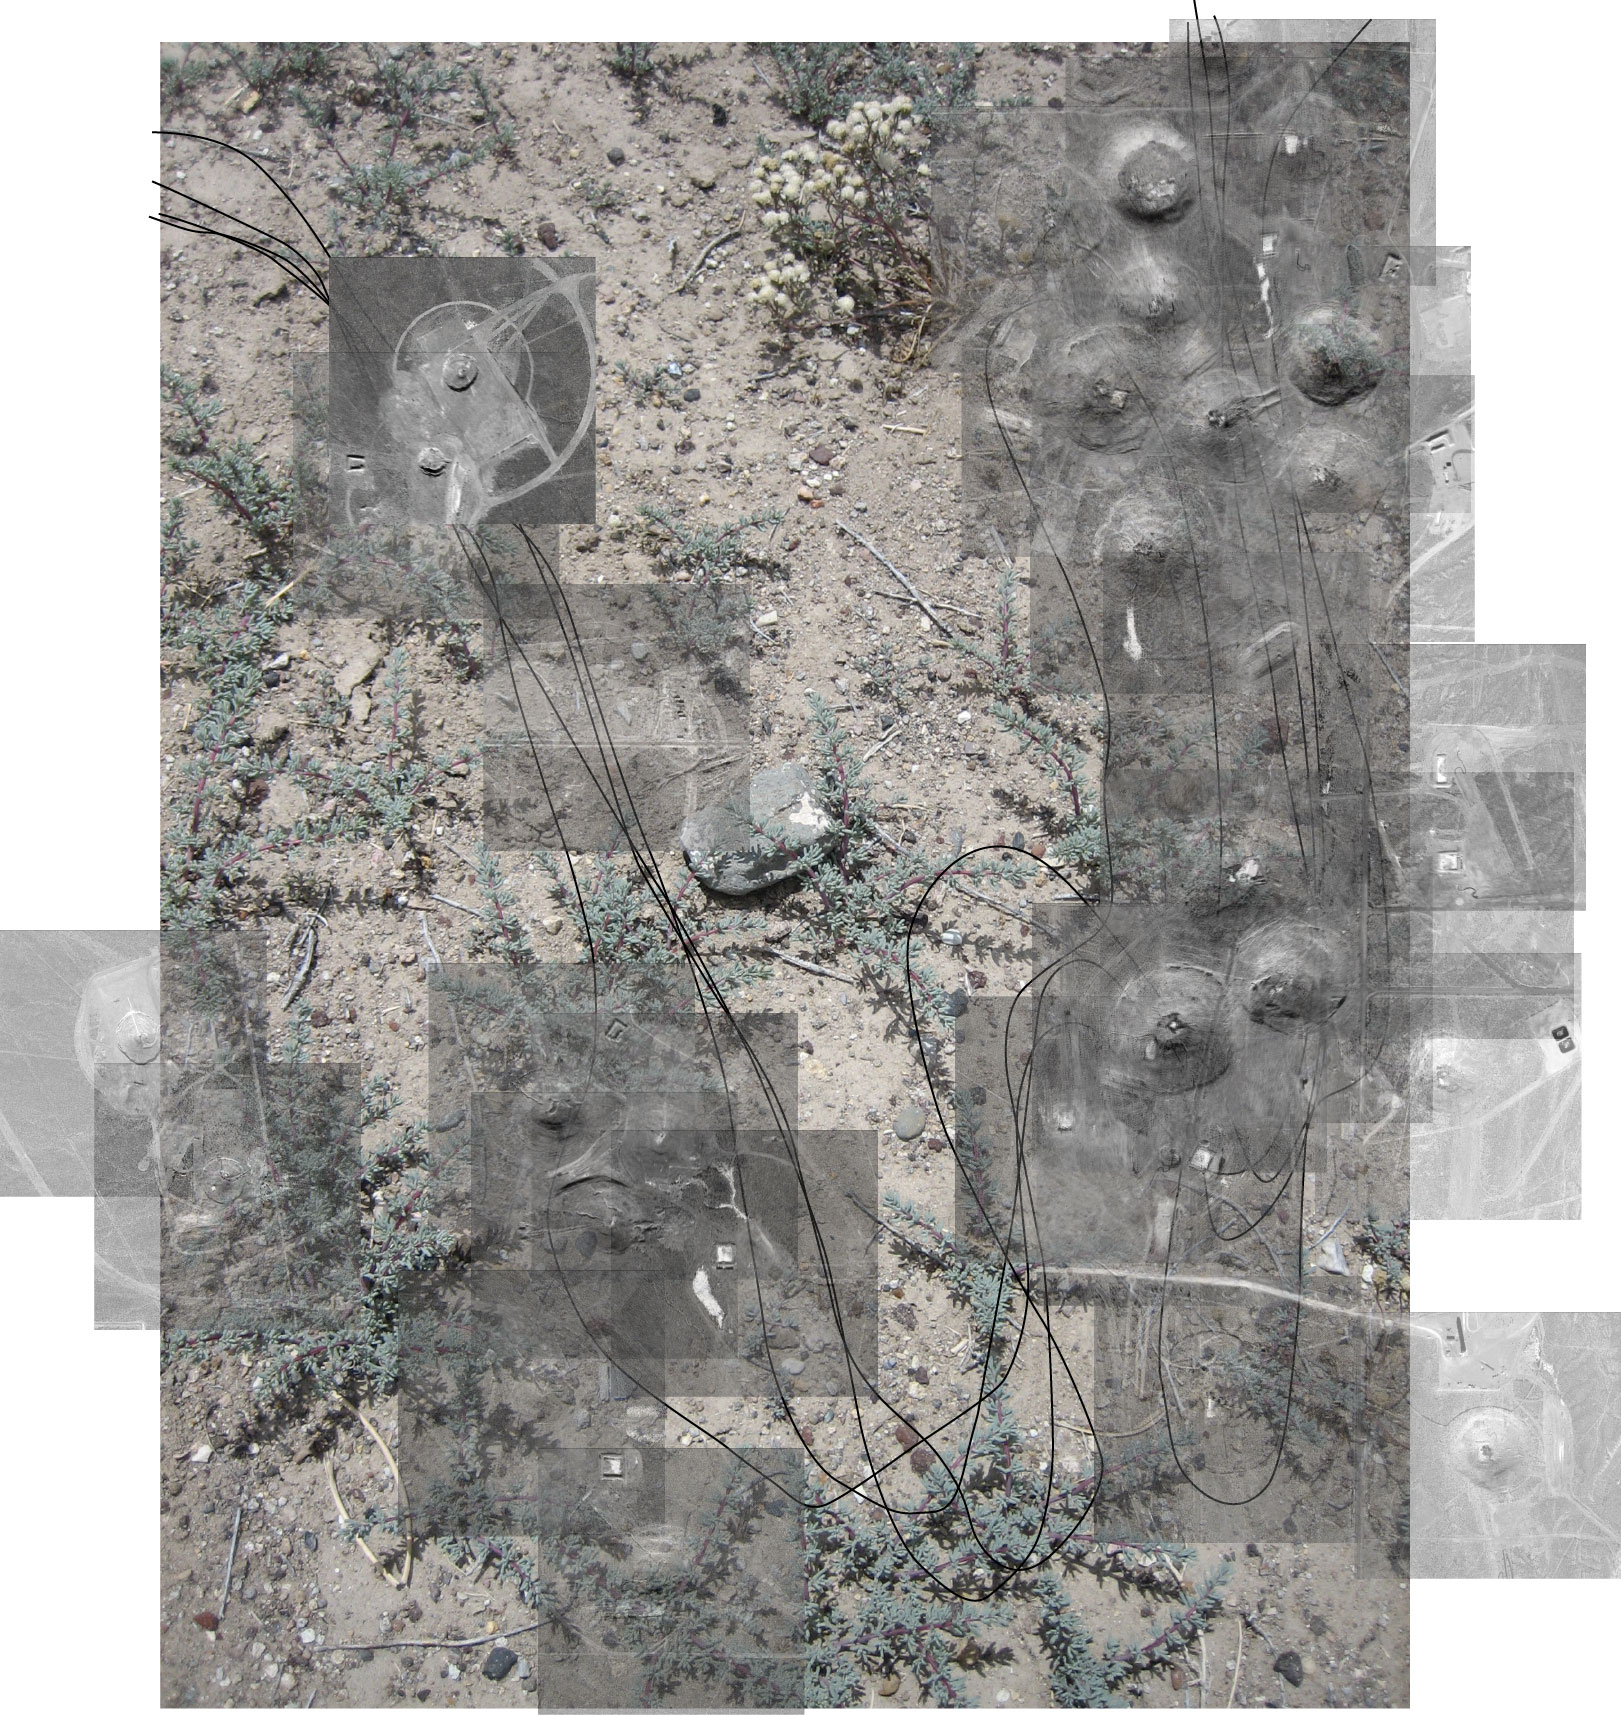
I am working to create an alternate view which will present a relational view of the detonation sites. Below is a sketch from my storyboard.
This is a screen shot from the mapping in progress. I am mapping my individual images to a USGS map of Yucca Flat.
This is my data. All layers of information are in one excel sheet. The website pulls dynamically from this data file.
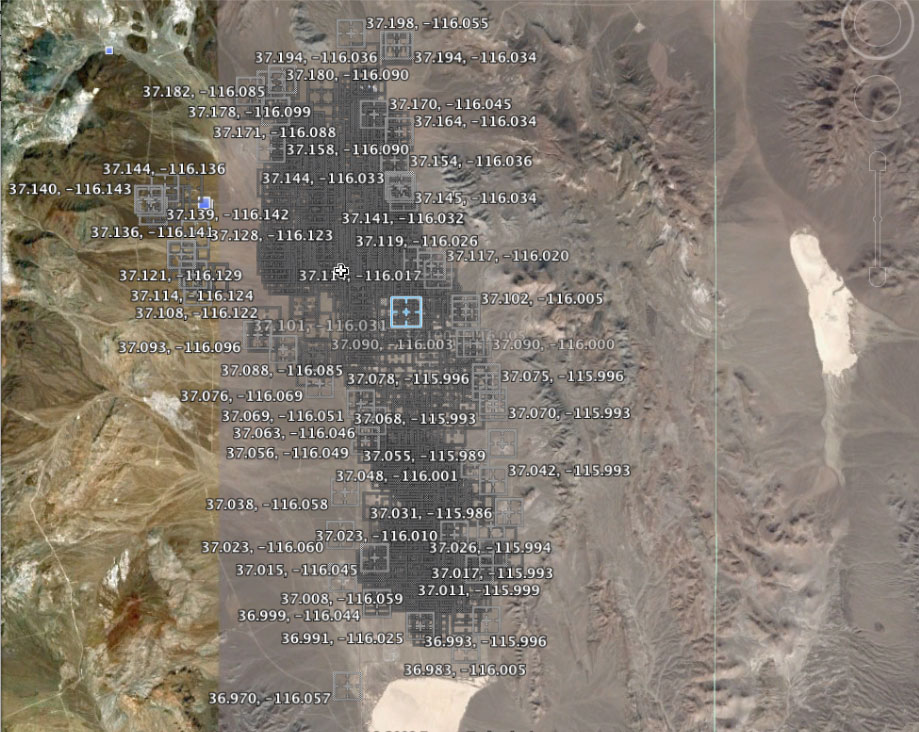
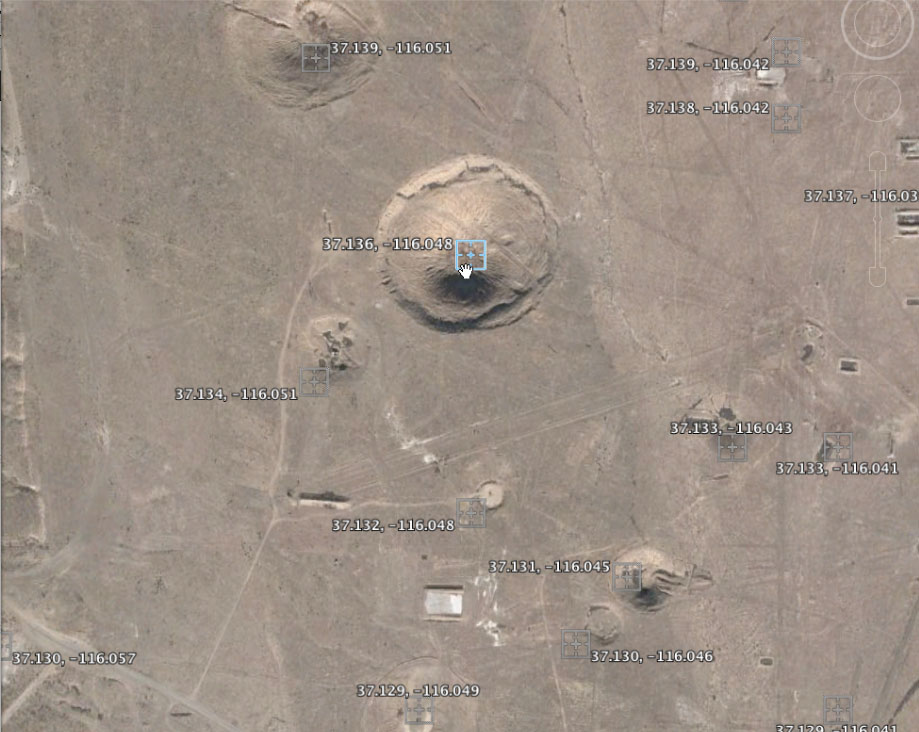
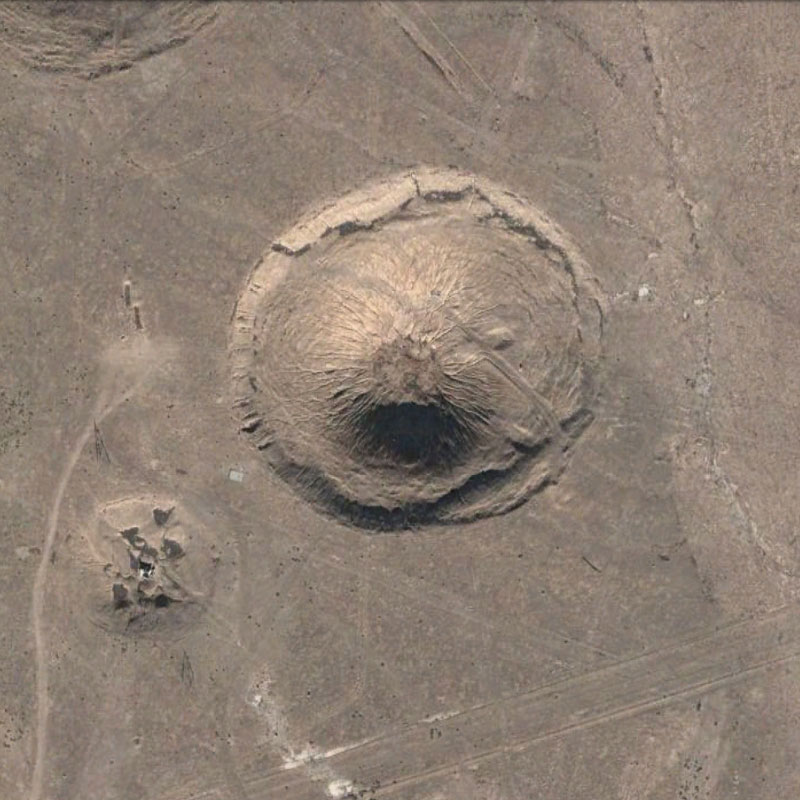
These next few images give you a sense of my process for collecting the individual photos of each detonation site from Google Earth. I plotted the coordinates for each explosion and captured screen shots at an elevation of 700 km.
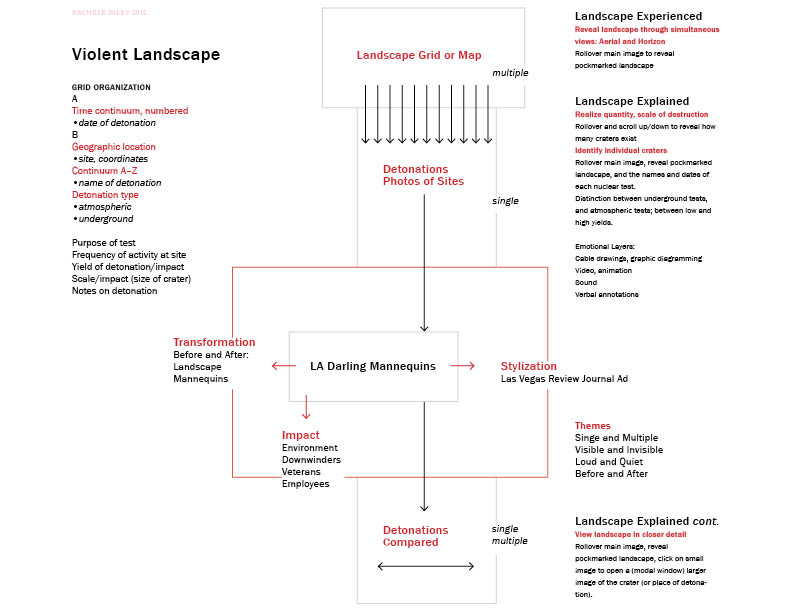
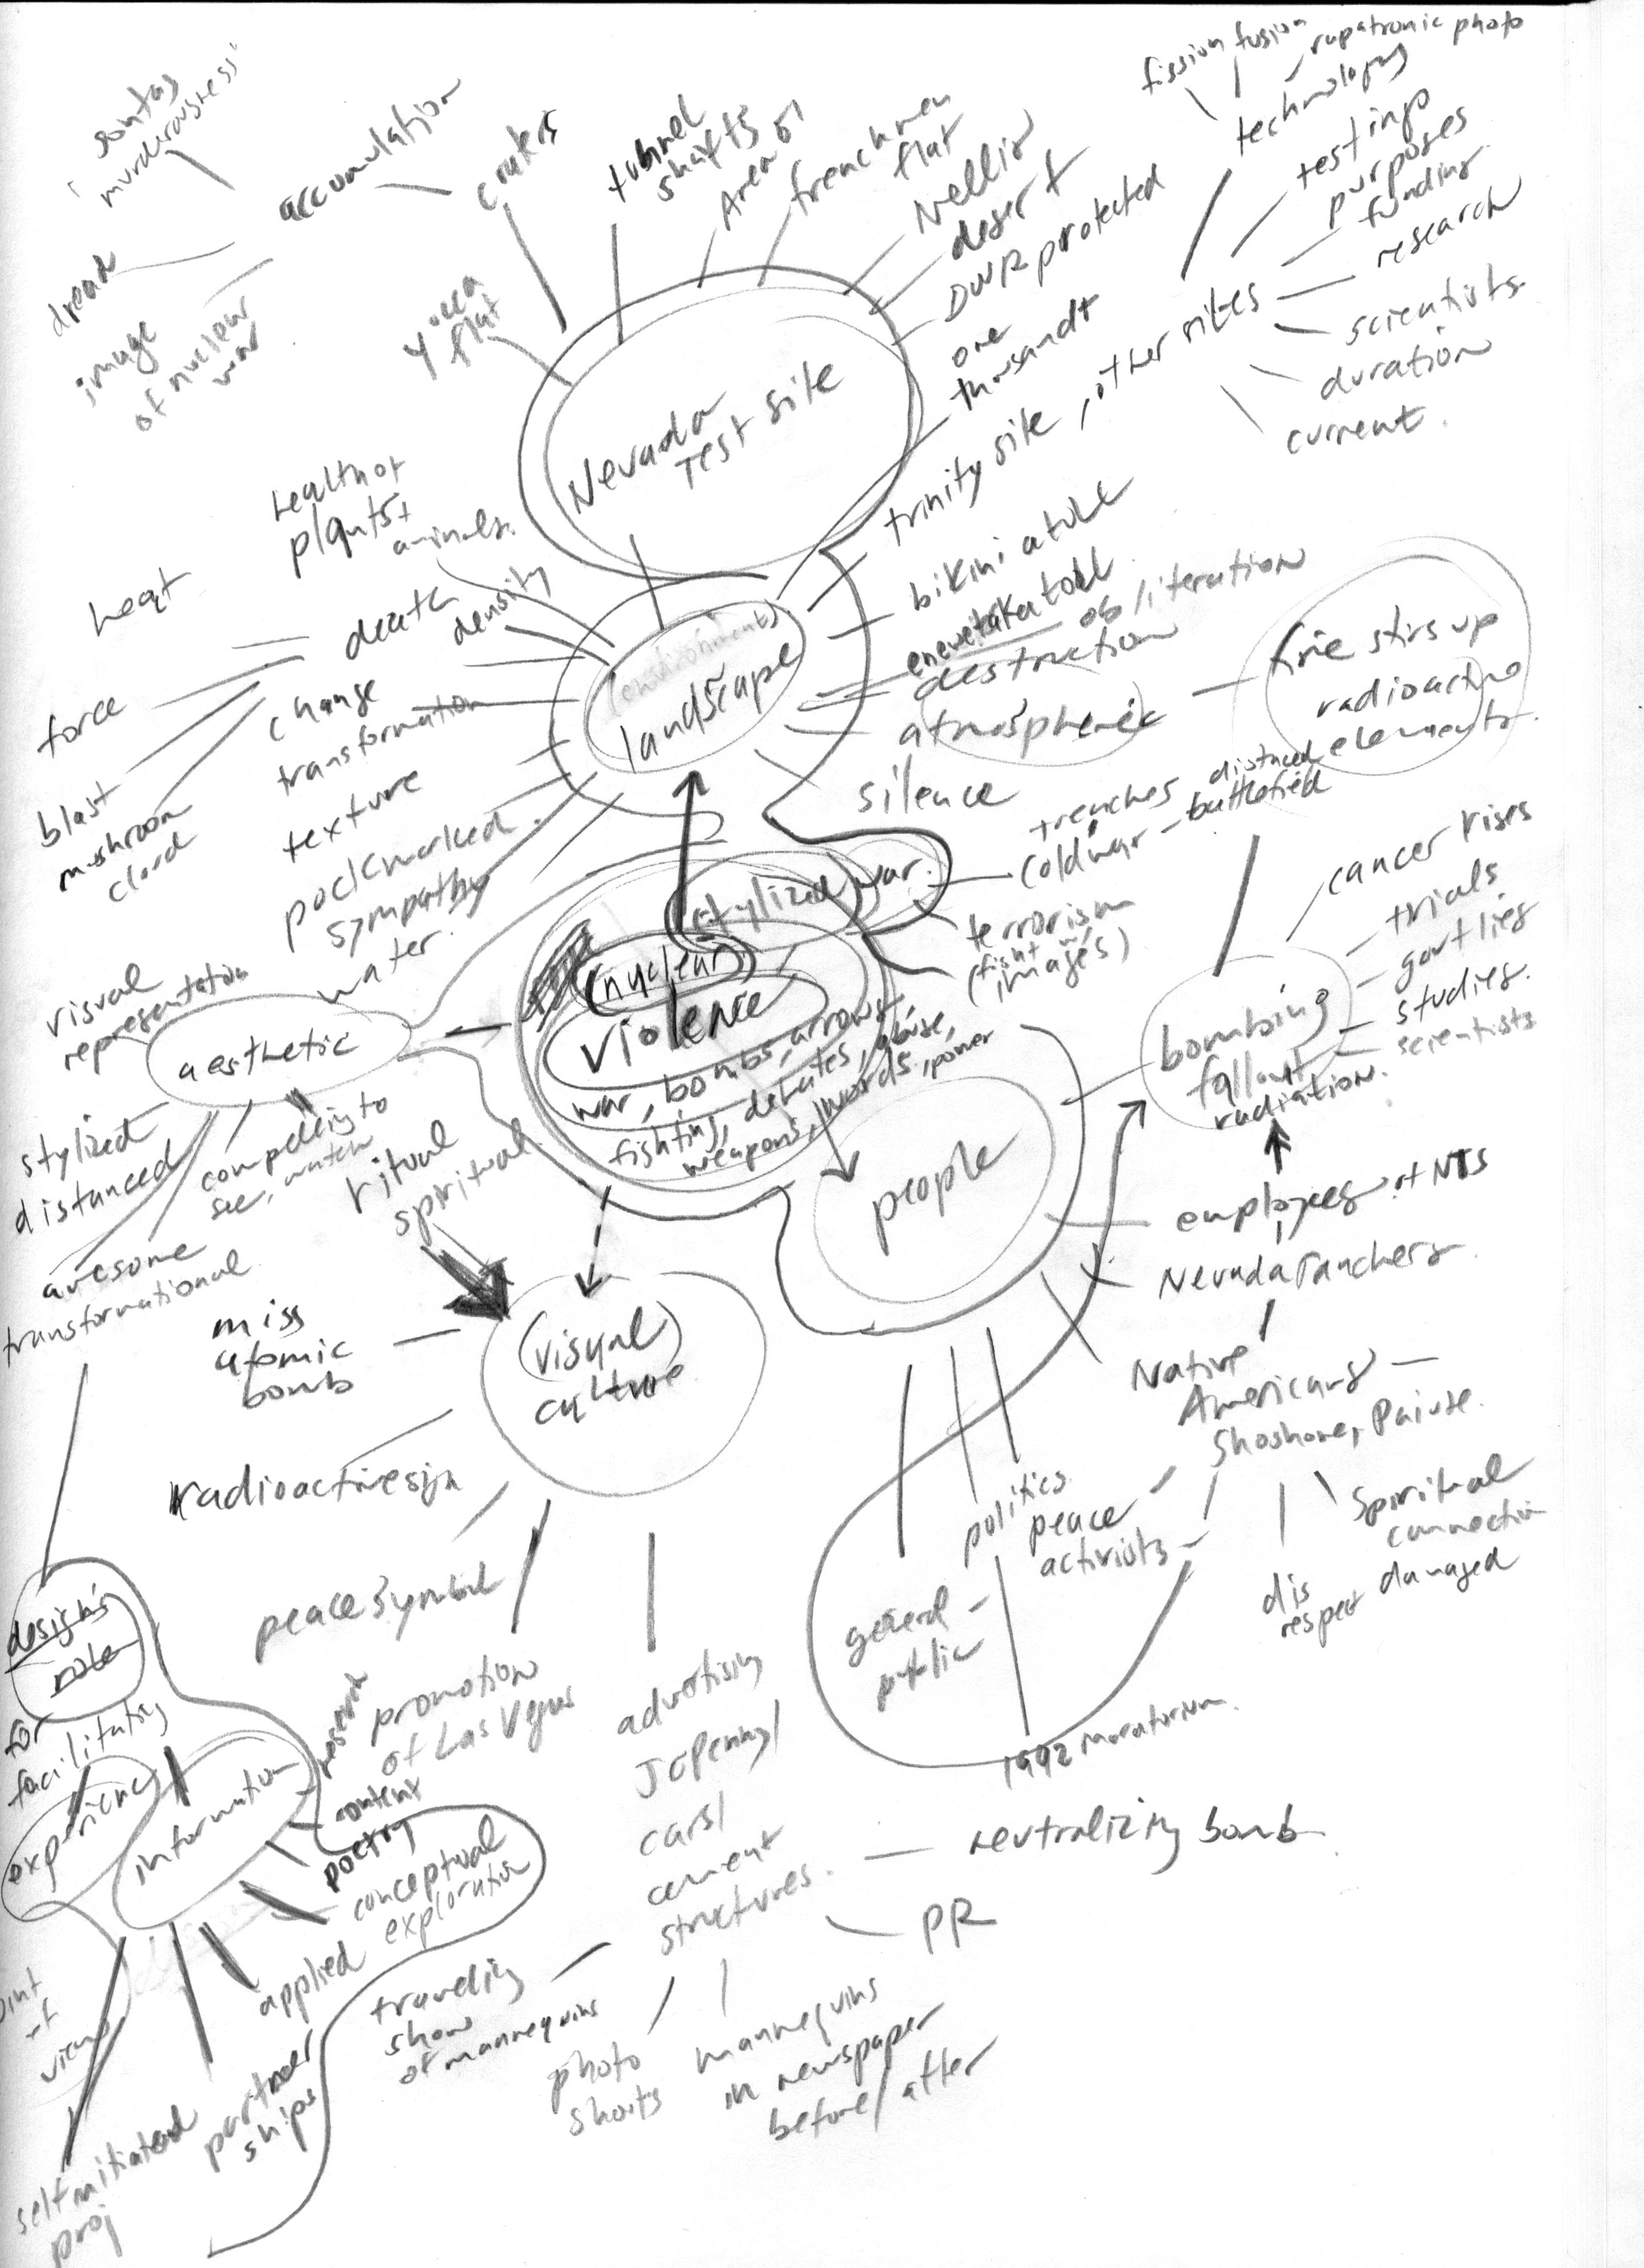
I created this concept map for the archive to show the relationship of various layers and to use when discussing the design and development.
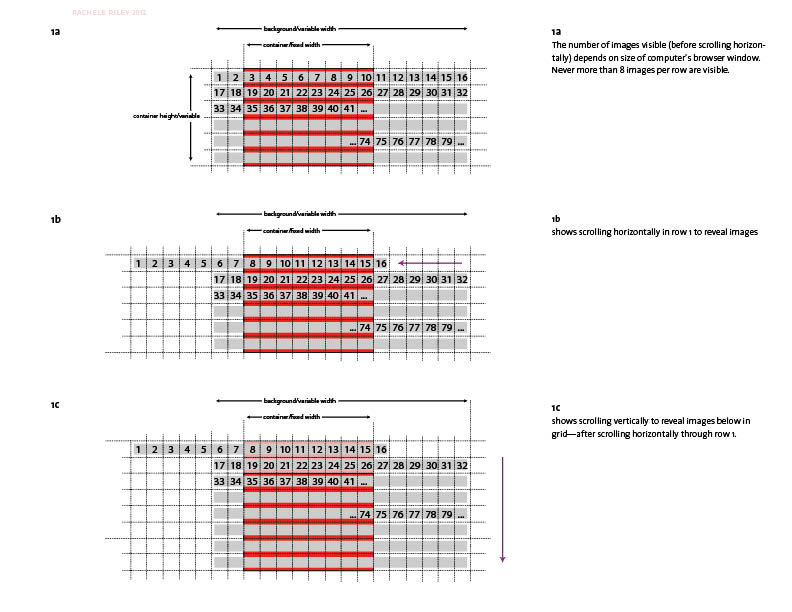
This diagram communicates the structure and movement of the archive organized by time (grid view). Used primarily in discussion with programmer, Danniel Gaidula.
An initial concept map for an early prototype, which, with Danniel Gaidula’s help, I have now completely re-coded.
An early mind map for the project.
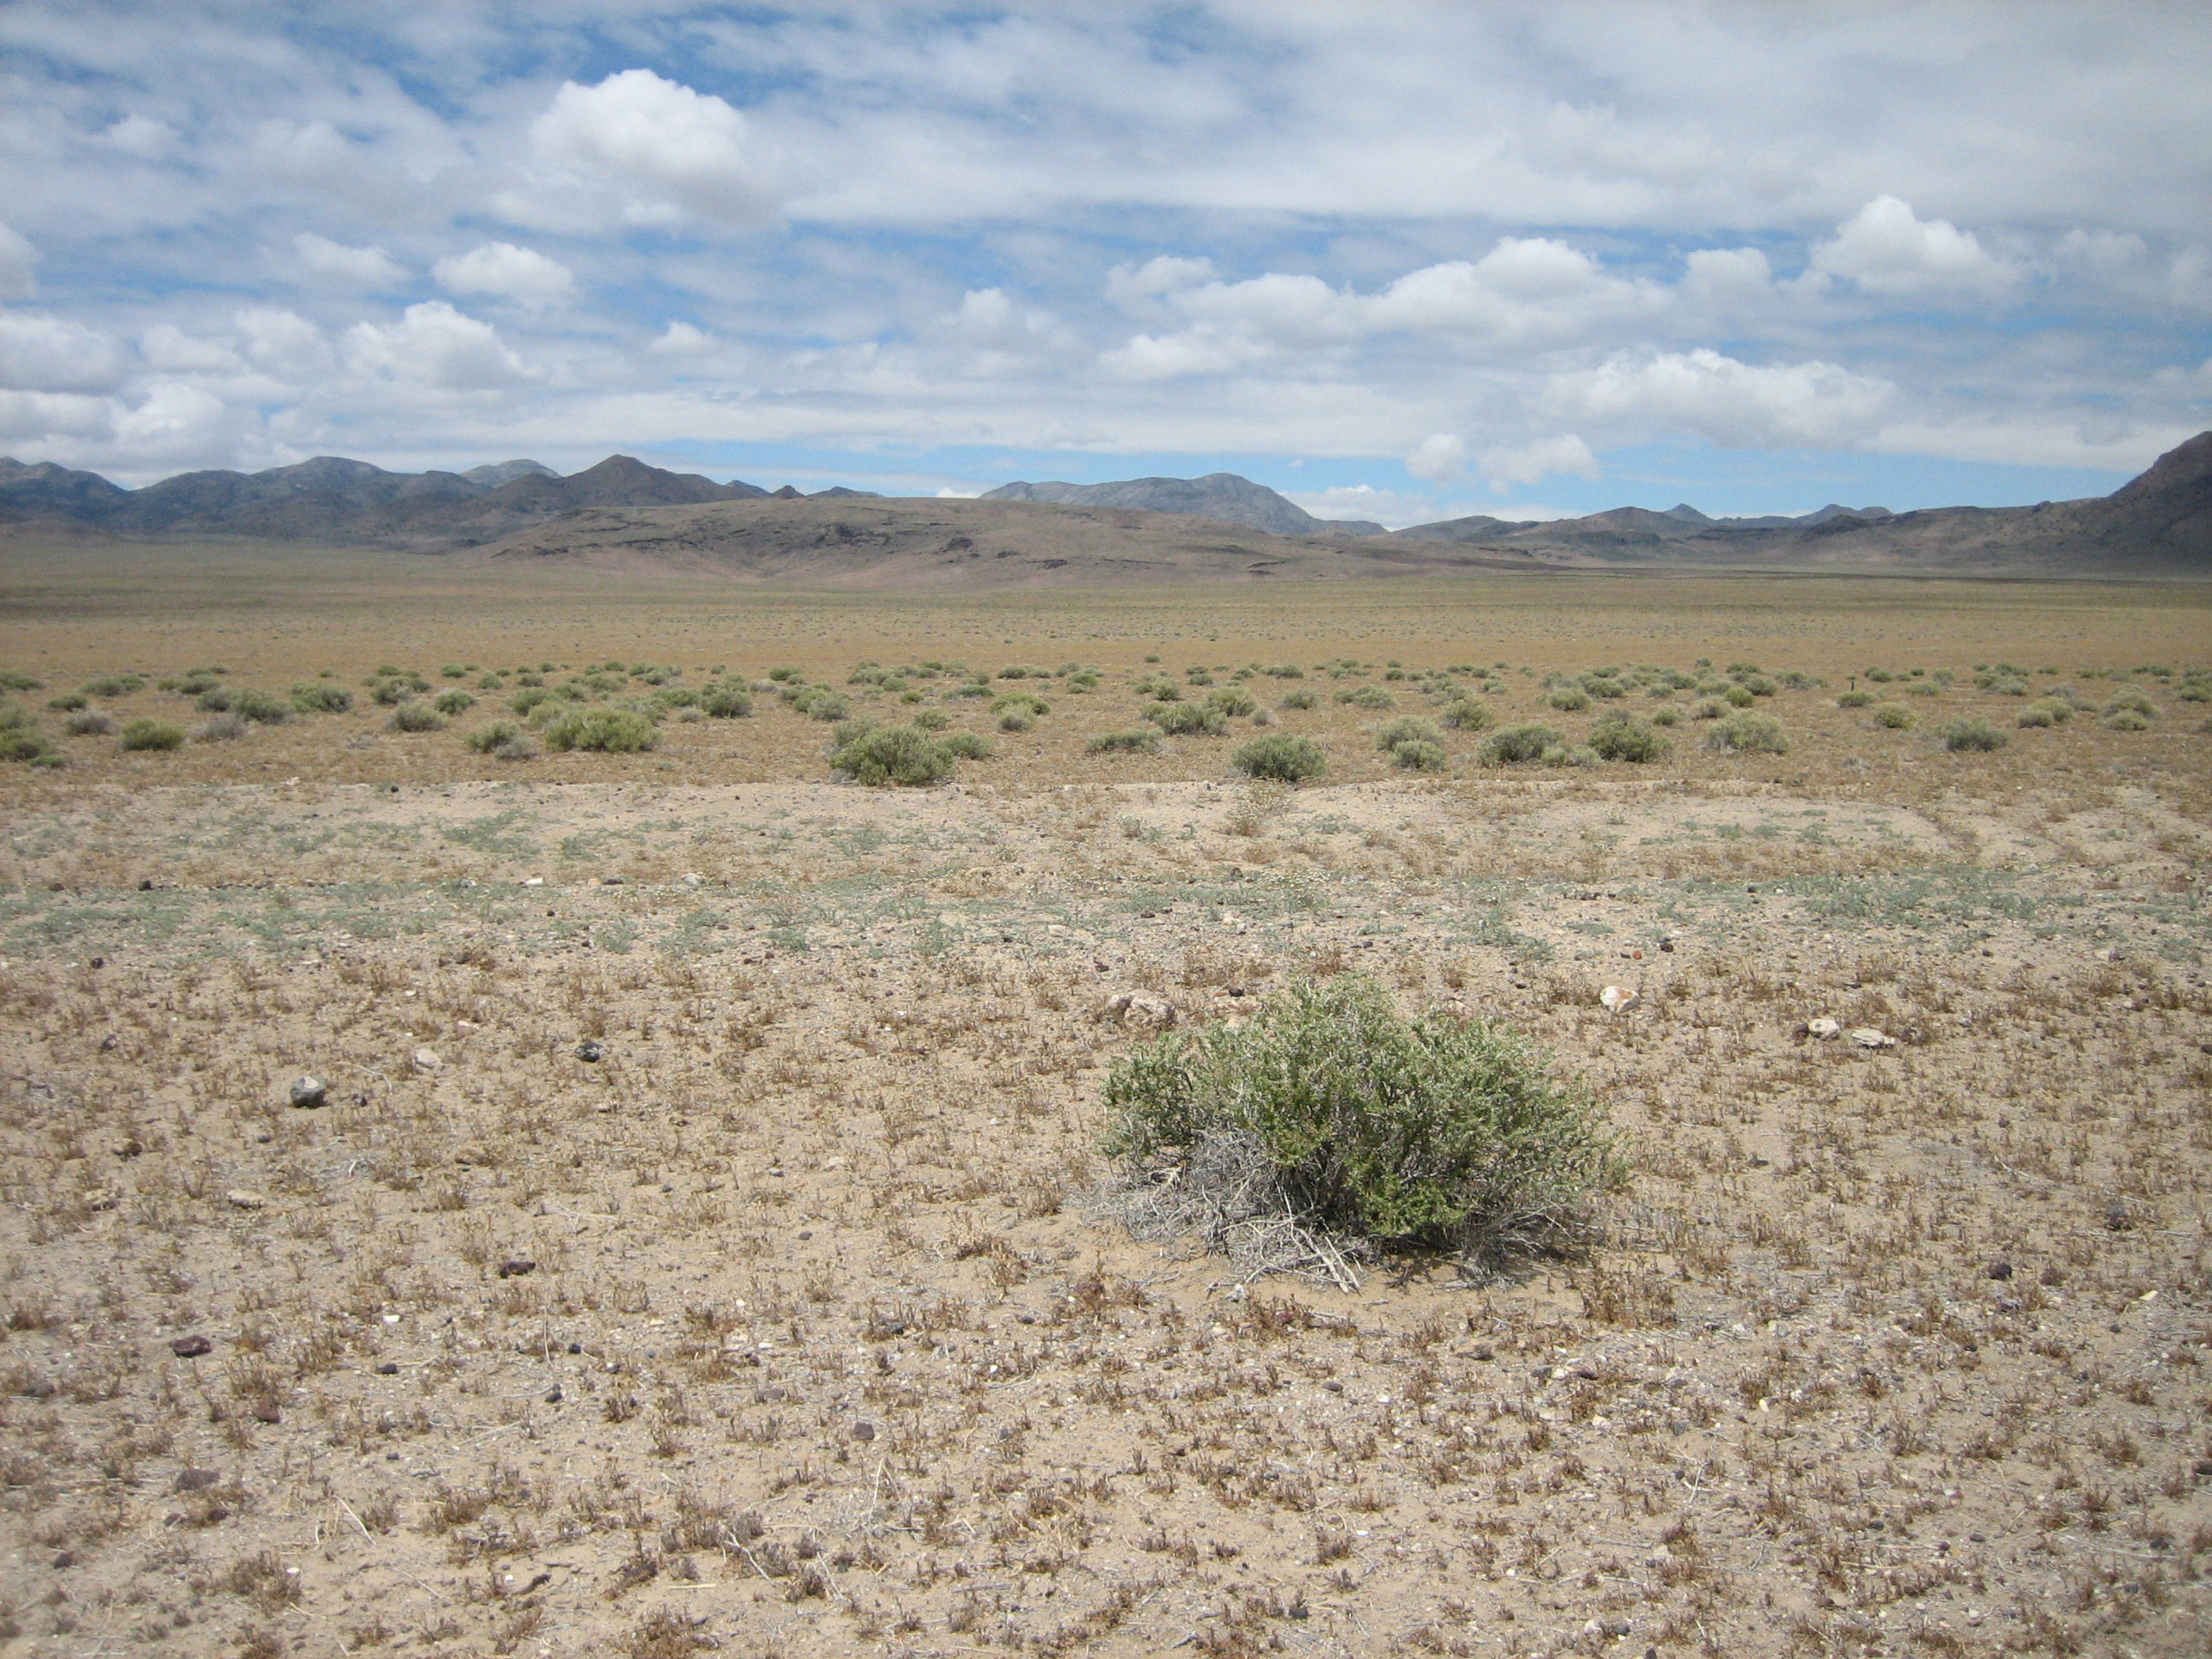
One of several photographs of the environment that I shot in May 2008 when I traveled to the site and around its periphery. These are used in the website to present a horizon view of the valley, in contrast to the aerial views.
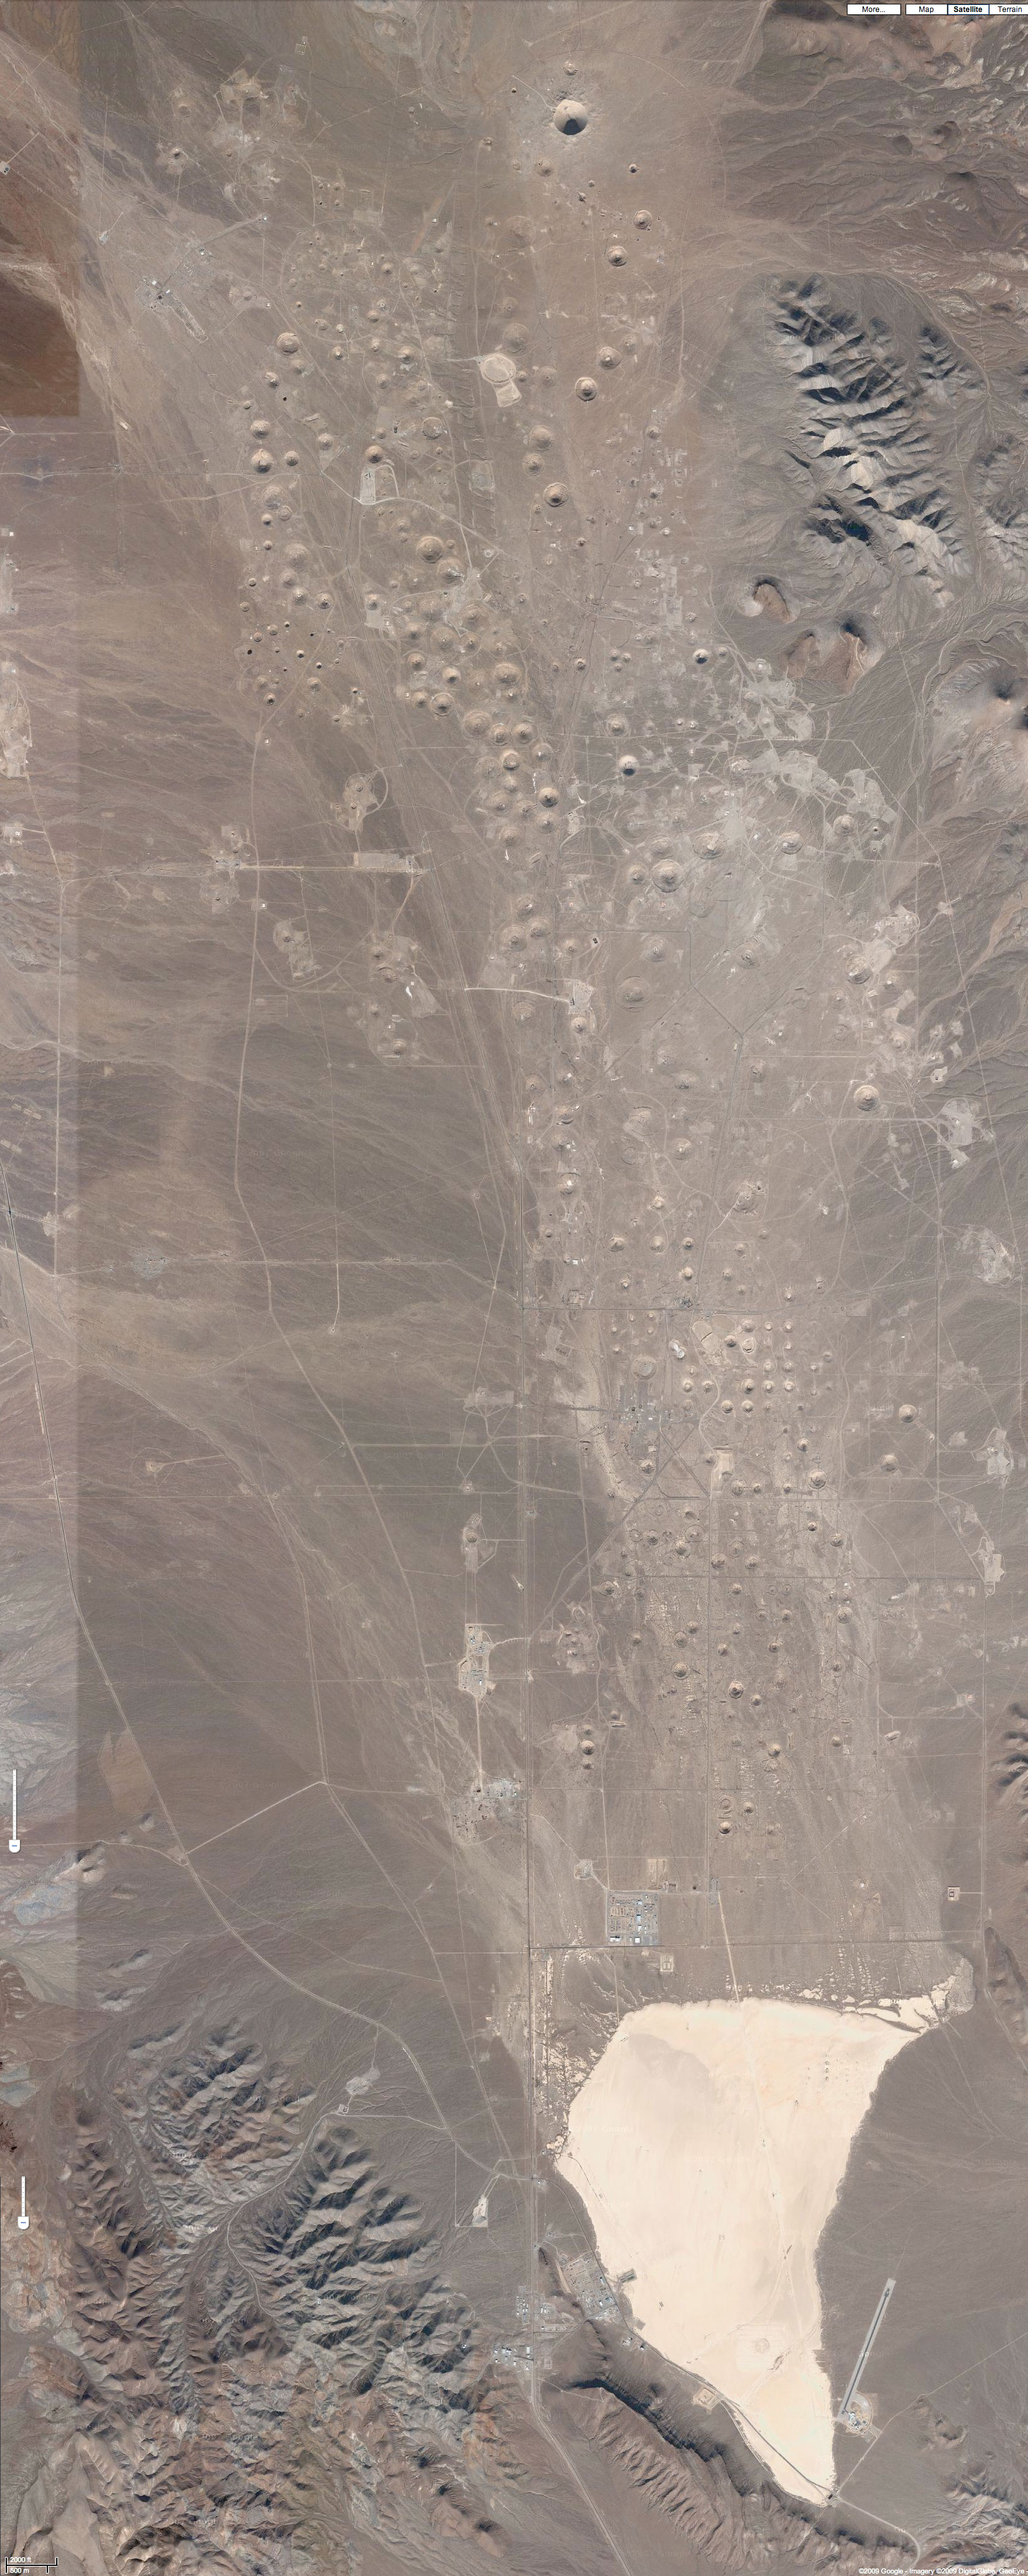
I tiled together hundreds of screen shots from Google Maps’ satellite view to form a complete aerial view of the valley. This was made after my trip in 2008.
I made a relief mapping of the craters. It is a test for collograph relief printing.


