Plans for Part One.

Screen Shot 2013-02-28 at 7.33.02 AM
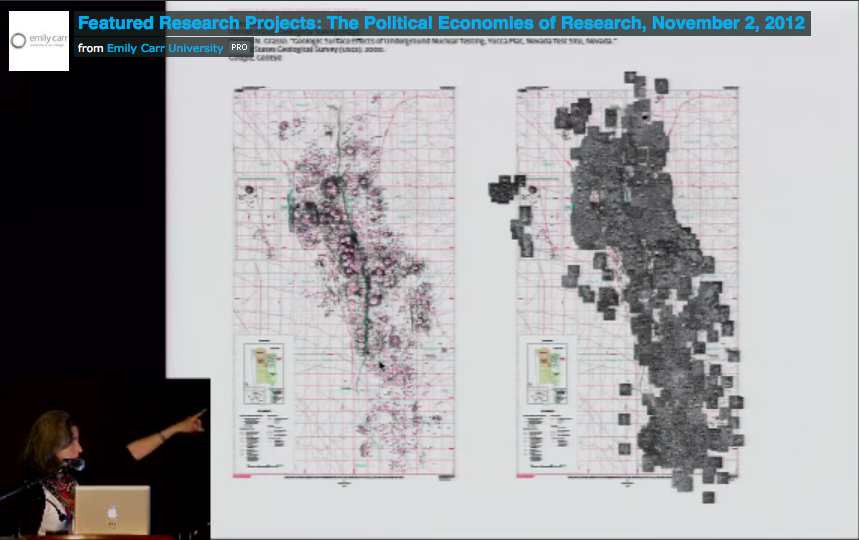
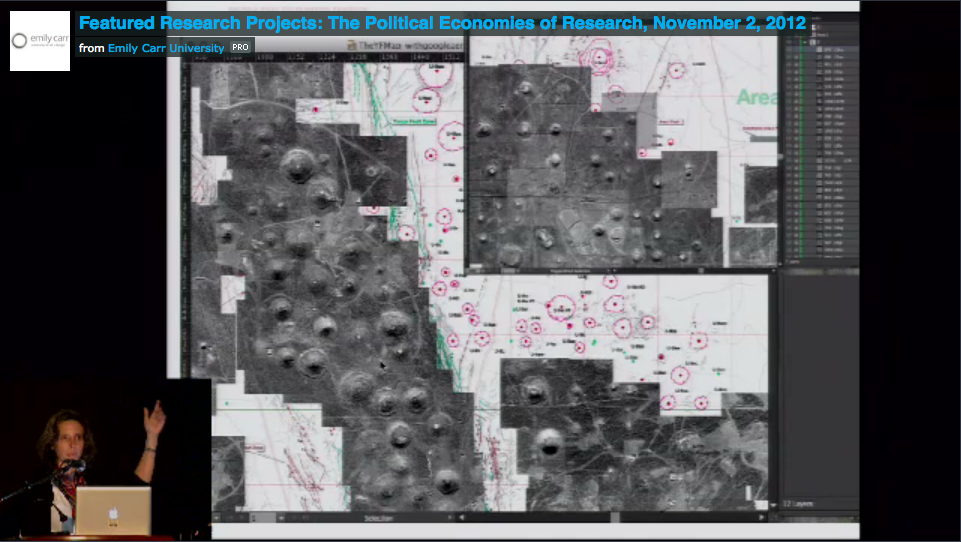
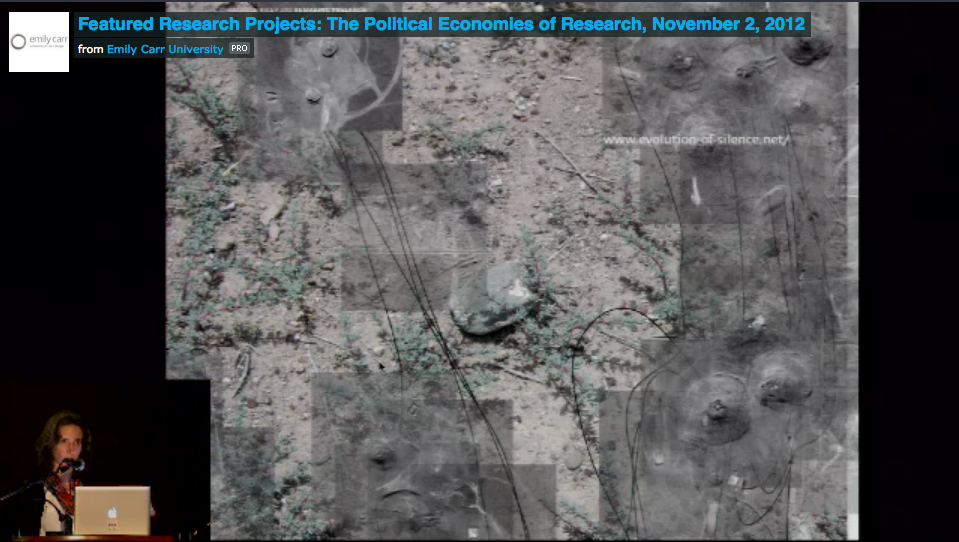
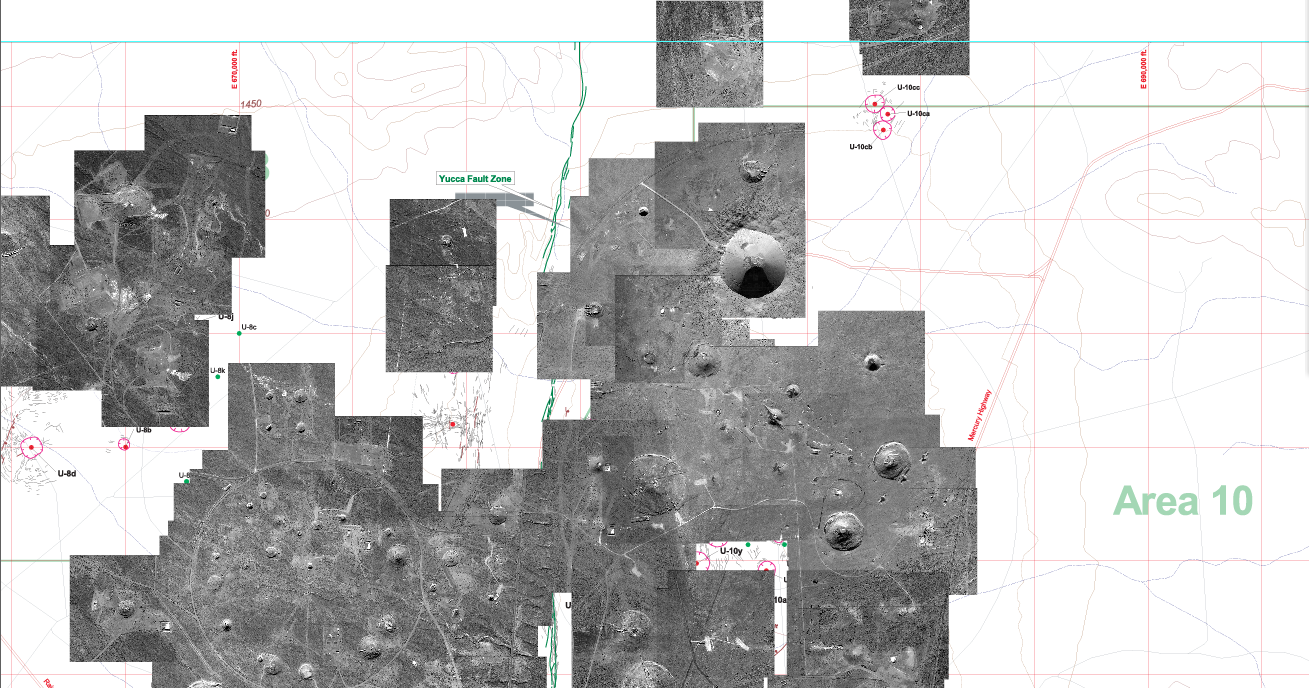
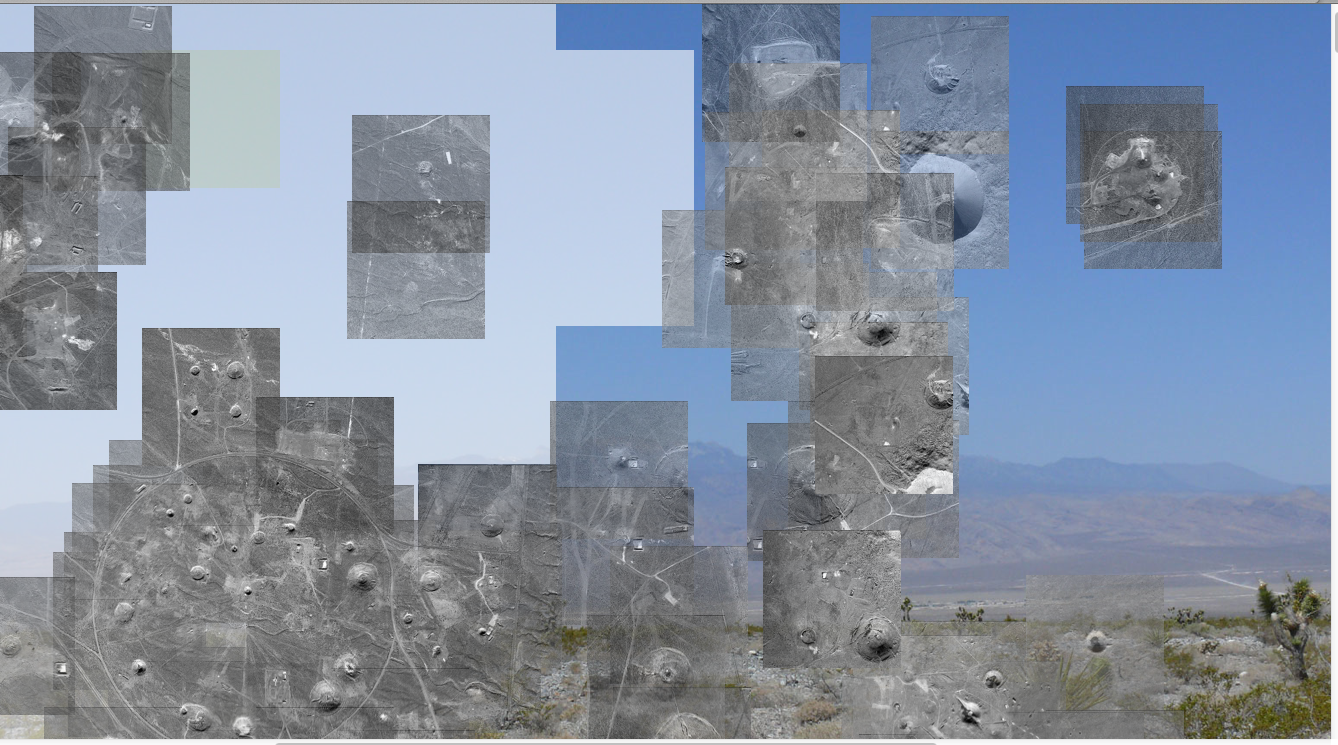
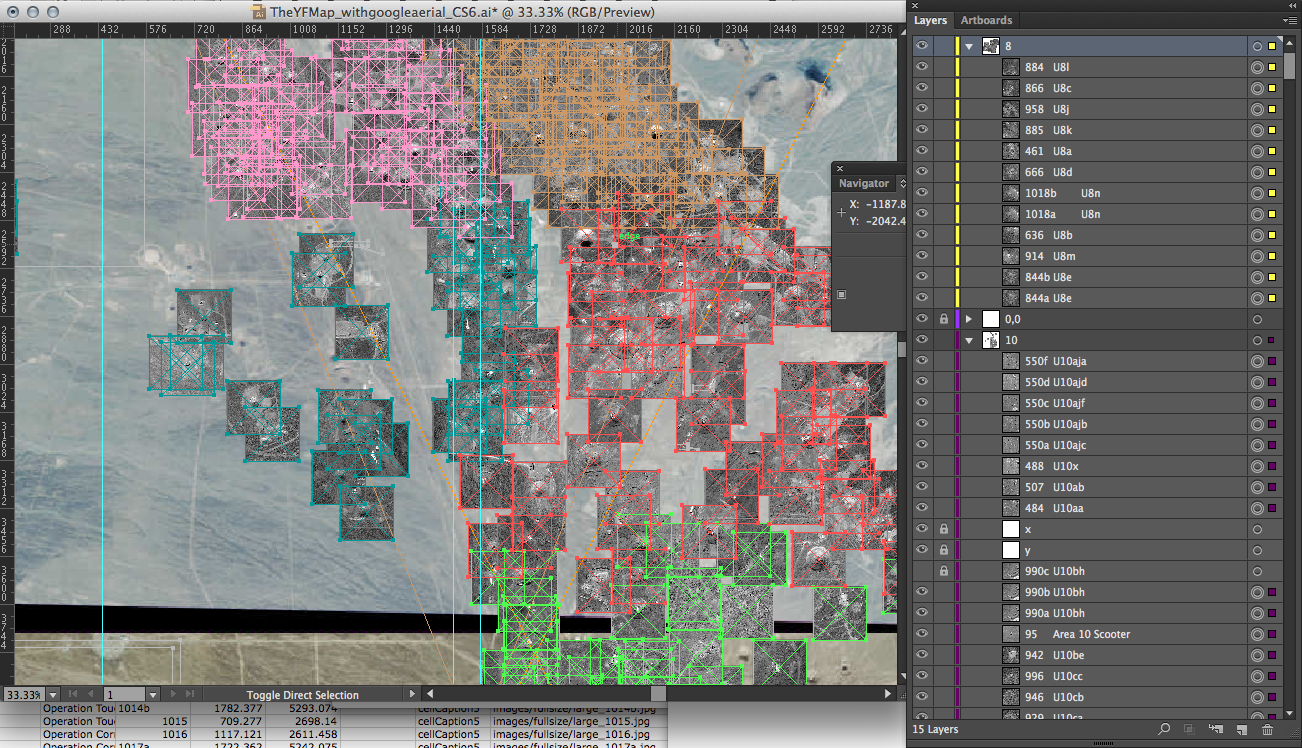
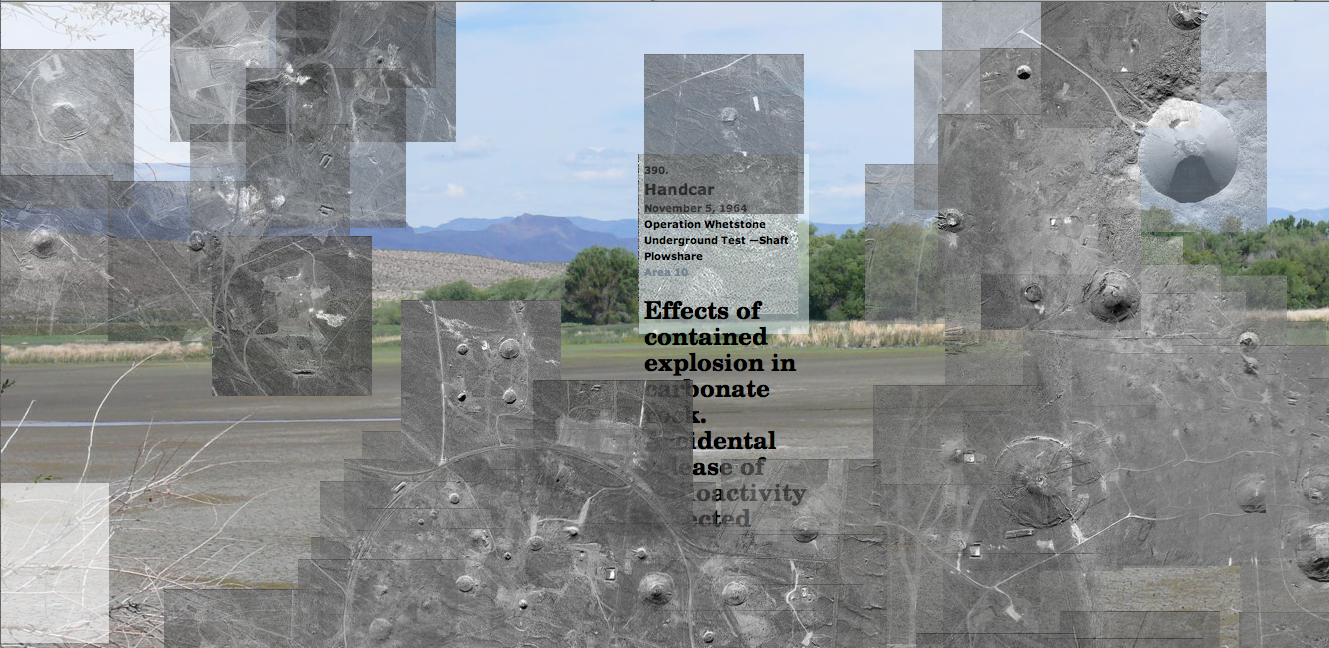
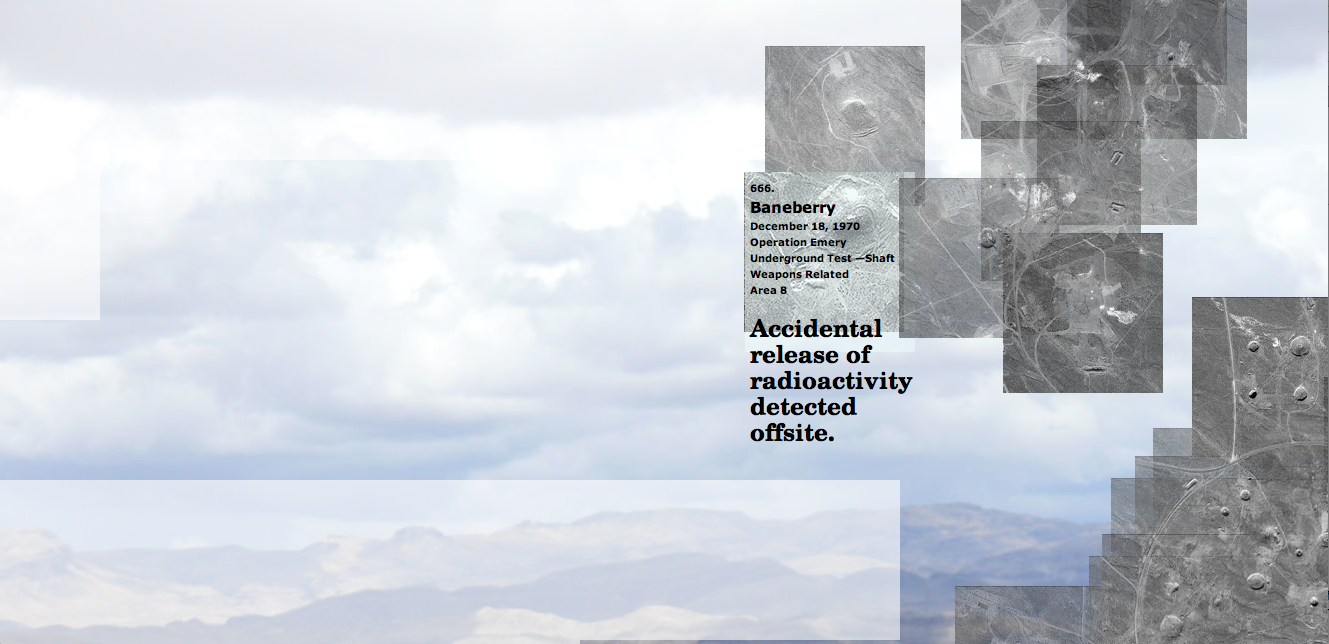
I finished fixing the coordinates last week, and now the images tile correctly to form a view of every single detonation in Yucca Flat. It is intentional that it is still fragmented, in order to make visually clear that in those areas of the valley no nuclear detonation occurred. These gaps in information are views through the accumulated image, and lead to more and more complex layering of image, text, video. My goals with these layers are to explore the valley over time, convey dynamics and scale, present the ruins of testing, and share documentation of the impact on people’s lives and the environment. At the moment, photographs from the Desert Wildlife Range and the surrounding areas of the Nevada Test Site are visible.
Screen Shot 2013-02-28 at 7.31.32 AM
My plans for Part One (the web-based part):
1. Create a scale that shows proportion and relates the images of detonations to geography.

2. Create more complex and transforming soundscapes.

3. Connect sounds to each detonation that convey their yield or detonation type, or some other attribute.

4. Explore CSS animations to convey yield of detonation.

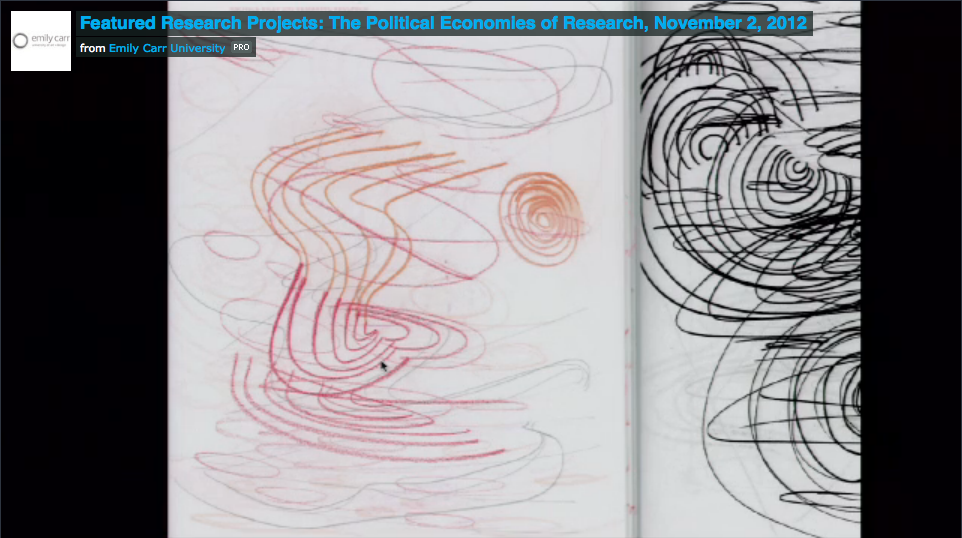
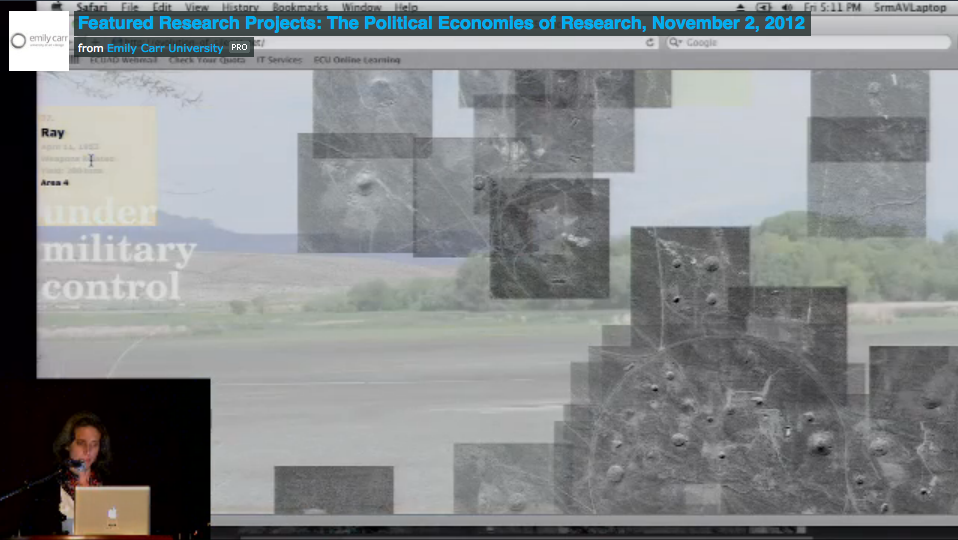
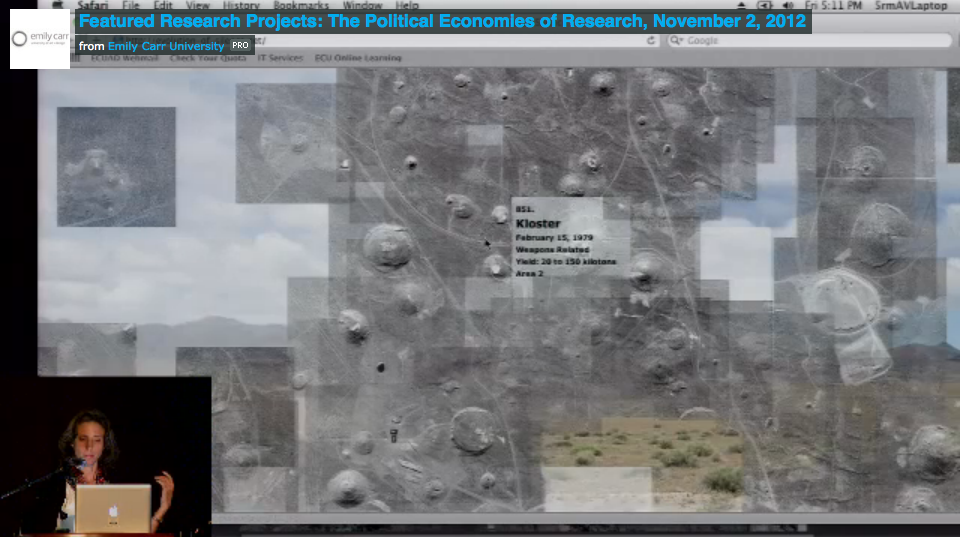
5. Create more drawings and expressive scans to incorporate as hover captions to detonation images.

6. Create captions that load dynamically for the lightbox images.

7. Animate vector drawings to convey impact and yield of detonation.

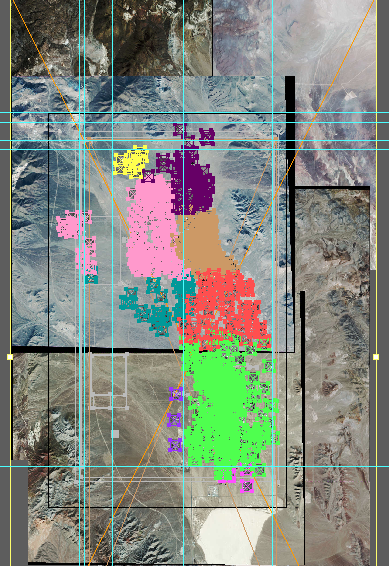
8. Create a toggle option to view the project organized by time continuum or by location (currently it is a combination: the atmospheric tests are organized by time and the underground tests by location).

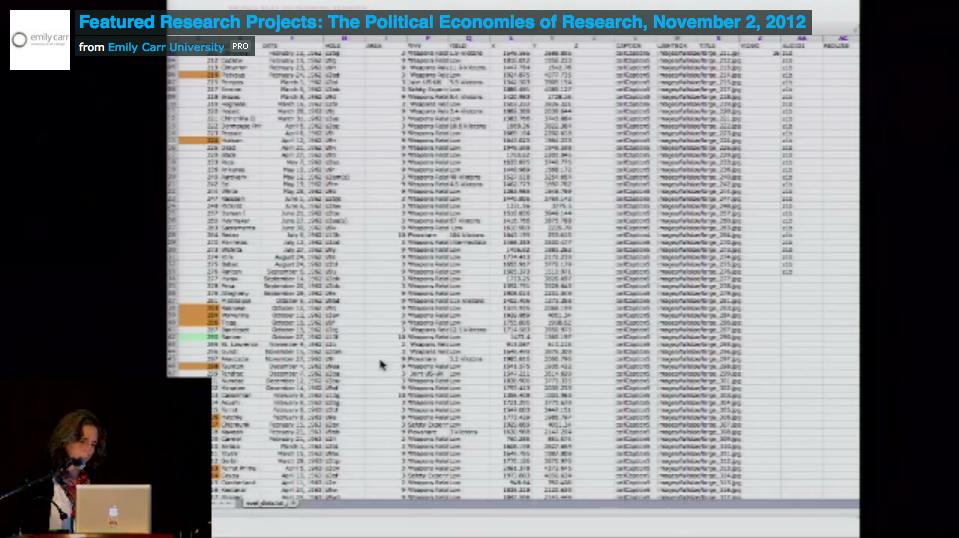
9. Create a text list of every detonation as a way to emphasize the naming of tests and to help viewers locate detonations in the tiling.

10. Create search function so that a viewer’s entry point could be a date, or a name, or an Area of the valley. Currently one travels from most northern part of the valley and heads South.

11. Create a system for showing how the viewer is navigating North, South, East, West.

12. Incorporate other archival research:

USGS photographs of detonation sites (before and after)
images of atmospheric tests from the National Archives
images of mannequins being dressed and set in houses
images of mannequins from the JC Penney advertisement (before and after)
images newspaper articles on the mannequins and other tests
images of houses, cars, furniture, food items, roof tiles, paint samples, animals tested
transcript (or recordings): for example of Baneberry trial
images of protests
images of ephemera and printed material
transcripts of oral histories
notes from two Nevada Test Site tours

13. Create a participatory interface in which viewers can submit their own interpretations or repsonses to form a layer on the site.

Screen Shot 2013-02-28 at 7.32.19 AM

Part Two, as you may remember from earlier introductory posts, is to extend the website into an exhibition. I am hoping to have more time soon to design a proposal and to research ways to translate interactivity for the web into an interactive physical environment.

My presentation at the ‘Remaking Research’ symposium.

Screen Shot 2013-02-04 at 10.59.30 AM
The Emily Carr University of Art and Design has archived the ‘Remaking Research’ symposium online. Here is the link to video documentation of presentations made in ‘Featured Research Projects’ under the theme ‘The Political Economies of Research’ on Friday, November 2, 2012. My presentation is third.

More stills from my presentation. My map of Yucca Flat in detail:
Screen Shot 2013-02-04 at 11.08.29 AM

I love to talk about the research, the data I gathered, and the role my Excel sheet plays in the programming and design. I always show images of it.
Screen Shot 2013-02-04 at 11.02.52 AM

Drawing is often a way to get to know something, and it lives on in my web-based project:
Screen Shot 2013-02-04 at 11.00.37 AM

My vision for the Web: spatial, simultaneous, exploratory.
Screen Shot 2013-02-04 at 11.01.39 AM
Screen Shot 2013-02-04 at 11.15.11 AM
Screen Shot 2013-02-04 at 11.15.37 AM
Screen Shot 2013-02-04 at 11.16.04 AM

Here you can view the opening presentations to ‘Remaking Research.’

Proofing my map.

It’s especially moments like these when I wish I could afford to hire a studio assistant. After hours of mapping Yucca Flat last fall, I realized in proofing details in my code, that some of the coordinates for the map are wrong, and that the web is not translating parts of it correctly. It’s difficult to pinpoint where the mistakes are (with so many images tiled upon another), so I have no other option but to go through each detonation again. I will copy the ‘x’ and ‘y’ coordinates again for each: from my master map in Illustrator into my database in Excel (the file that drives the web map). This is a time-consuming task and, as a result, my other studio plans come to a halt. The map is one of the dominant visual features to the archive and it must be accurate. Starting today, let’s see how long this takes me.

My map in Illustrator (Area 2 and 10 in view):
Screen Shot 2013-01-30 at 9.44.10 PM

The web version where you can see some detonations are not tiling correctly:
Screen Shot 2013-01-30 at 6.16.09 PM

All Areas highlighted in Illustrator:
Screen Shot 2013-01-30 at 10.32.10 PM
Screen Shot 2013-01-30 at 10.58.47 PM

The database in Excel, with columns for x and y coordinates isolated:
Screen Shot 2013-02-03 at 10.08.28 AM

Back to web map:
Screen Shot 2013-02-02 at 5.05.15 PM

Mapping for the web-based archive, the beginning.

This is a screen shot of the web-based archive in which the detonations are organized initially by time (grid view). It presents the sites as fragments of a landscape.

I am working to create an alternate view which will present a relational view of the detonation sites. Below is a sketch from my storyboard.

This is a screen shot from the mapping in progress. I am mapping my individual images to a USGS map of Yucca Flat.

This is my data. All layers of information are in one excel sheet. The website pulls dynamically from this data file.

These next few images give you a sense of my process for collecting the individual photos of each detonation site from Google Earth. I plotted the coordinates for each explosion and captured screen shots at an elevation of 700 km.

I created this concept map for the archive to show the relationship of various layers and to use when discussing the design and development.

This diagram communicates the structure and movement of the archive organized by time (grid view). Used primarily in discussion with programmer, Danniel Gaidula.

An initial concept map for an early prototype, which, with Danniel Gaidula’s help, I have now completely re-coded.

An early mind map for the project.

One of several photographs of the environment that I shot in May 2008 when I traveled to the site and around its periphery. These are used in the website to present a horizon view of the valley, in contrast to the aerial views.

I tiled together hundreds of screen shots from Google Maps’ satellite view to form a complete aerial view of the valley. This was made after my trip in 2008.

I made a relief mapping of the craters. It is a test for collograph relief printing.

An Introduction to The Evolution of Silence.

An exploration of memory and destruction, ‘The Evolution of Silence’ is a multi-dimensional project that encompasses drawing, interactive design, mapping, printmaking, and installation. It is a creative investigation into the dramatic transformation of the Yucca Flat valley of the Nevada Test Site (Nevada National Security Site)—the site of experimental, post-World War II nuclear detonations.

I am creating a web-based archive, installation, and publication that present an exploration of a restricted landscape, and a visual mapping and interpretation of its destruction. ‘The Evolution of Silence’ allows one to bypass government boundaries and control of the area, making it possible for any individual to experience a cold war’s aftermath and silence.

The project gives form and expression to the data that I have gathered and organized, and is unique to other existing documentation of the Nevada Test Site in that it preserves an individual view of every nuclear detonation that occurred in Yucca Flat valley (828 nuclear explosions in total). The valley’s pockmarked surface of sink-hole craters is simultaneously beautiful and horrific. Considering the toll on the environment and the cost to human life, the valley is an important symbol of the impact of war.

I have been working on ‘The Evolution of Silence’ for a few years. The University of North Carolina at Charlotte funded my initial field research in 2008 (thank you), and since then, I have been working to design and develop an experience of a place of conflict for others. Thanks to The University of the Arts in Philadelphia, I have a sabbatical for the Fall 2012 semester and am going to be finishing Part 1 of the project: a web-based archive that presents multiple perspectives and experiences of the destruction. Part 2 will take place in 2013, as I prepare for the project’s extension and arrange for its public exhibition.